TRAINING · 1,207 SAMPLES
TCGA · Three cancers
CRC 620 · Gastric 409 · Pancreatic 178. The locked 158-gene expression background and OS annotations.
Download TCGA data ↓Calculate PRISM-GI scores for a research cohort. Expression data stays in your browser; the frozen model runs locally.
One source cohort and one cancer type per file. Include the 158-gene ranking background, not just the 15 model genes. At least 150 background genes and all 15 model genes are required.
Download input template (2 example rows) · Format guide
Loading the frozen model…
Load a cohort to calculate relative risk scores, compare samples within that cohort, and download the results.
Processed public-cohort subsets used in this project. Each ZIP includes expression matrices, overall-survival annotations and a README. Score each source cohort separately.
CRC 620 · Gastric 409 · Pancreatic 178. The locked 158-gene expression background and OS annotations.
Download TCGA data ↓GSE17536 (177) and GSE39582 (579).
Download colorectal data ↓GSE62254 (300) and GSE84437 (433). Source-processed expression, ready for within-sample ranking.
Download gastric data ↓GSE57495 (63), GSE62452 (65), GSE85916 (79). GSE28735 excluded because of known overlap with GSE62452.
Download pancreatic data ↓Two synthetic example rows with age, stage and expression values, gene dictionary, and full GSE17536 public example cohort.
Input template (2 example rows) · Gene dictionary
Download example cohort ↓Network weights, preprocessing constants, implementation details and data provenance.
Data README · File checksums| Source | Cancer | Records | Role |
|---|
Public accession identifiers are retained. These are study subsets, not complete repository datasets. Follow the original studies' attribution and data-use terms. Historical pooled pancreatic estimates based on 249 records have not been recalculated in this website.
PRISM-GI — Partial-domain-adjusted Rank-Integrated Survival Model for Gastrointestinal cancers.
Average-tie percentile ranks are calculated across the available locked 158-gene background. Only then are the 15 model genes selected.
The frozen executable uses cohort-mean alignment with λ = 0.5, followed by its saved training means and standard deviations. Cohorts must be scored separately.
A frozen 15 → 16 (tanh) → 1 DeepSurv network outputs a relative log-risk score. Higher values indicate higher model-estimated hazard within the cohort.
Use processed bulk-tumor expression. The first column must be sample_id; subsequent columns are exact gene symbols. CSV and TSV are supported. Gene aliases, probe IDs and raw sequencing counts are not normalized or mapped by this tool.
Provide one homogeneous cohort, at least 2 samples (small cohorts require caution), and no duplicate sample IDs or gene columns. Do not combine cancer types or source cohorts. Use pseudonymous IDs; do not include names or contact information.
All 15 model genes must be present. At least 150 of the 158 background genes are required by this web tool; this is an input quality guardrail, not a validated missingness threshold. Omit columns for completely unmeasured background genes; blank or non-numeric expression cells are rejected. Optional age and stage columns are used only when the clinical nomogram is selected. Other additional columns are ignored. Replace both synthetic example rows with your own complete source cohort; two rows illustrate the format, not an adequate validation cohort. The cancer selector labels the analysis; it does not change the shared network.
PRISM-GI scores are relative log-risk outputs, not probabilities. Relative hazard is exp(score − cohort median). Compare scores within the same run; changing cohort composition can change the adjustment and scores.
Select Include clinical nomogram to combine each score with age and AJCC stage and estimate 1-, 3- and 5-year overall survival.
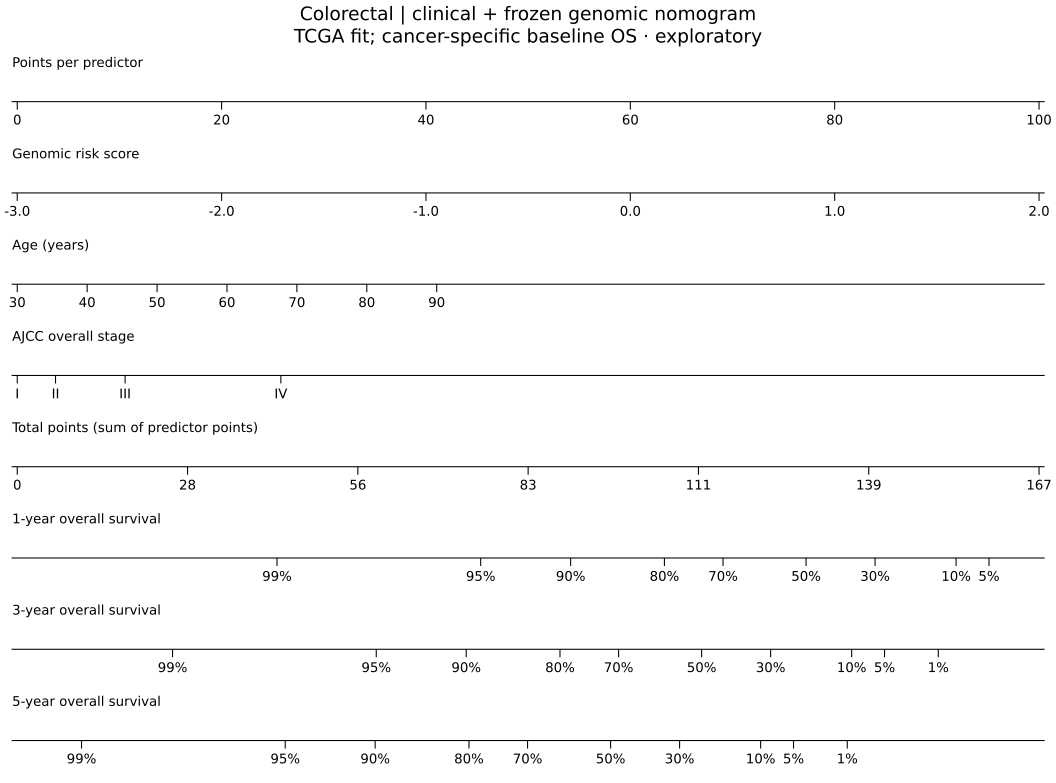
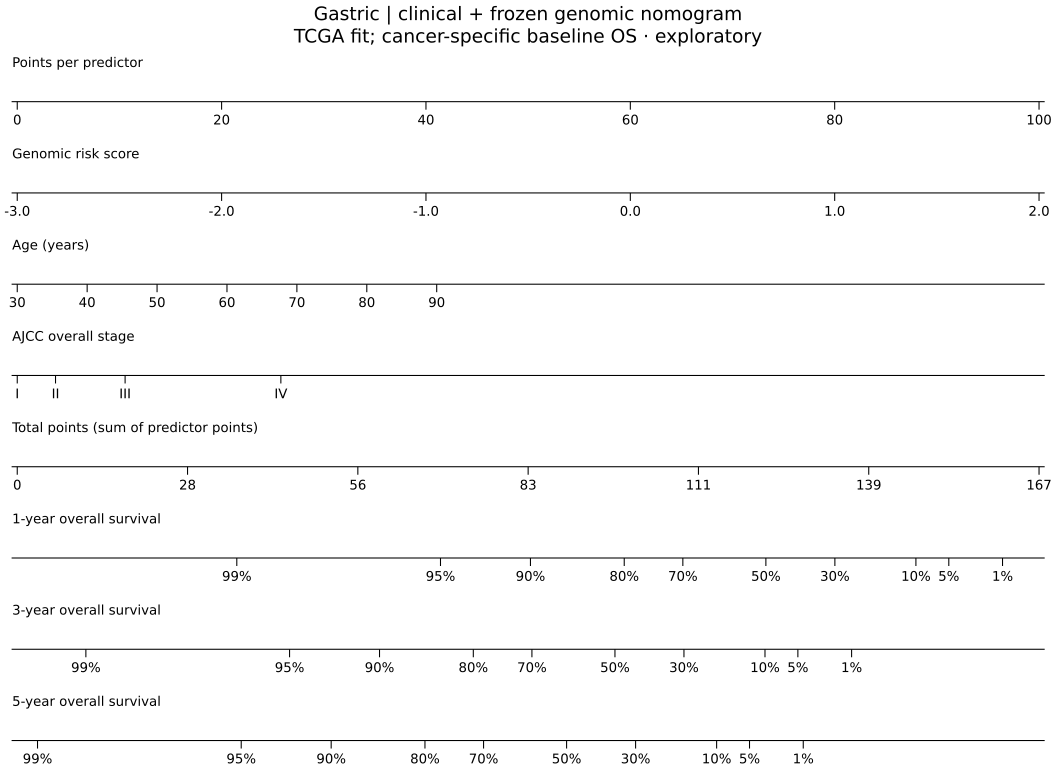
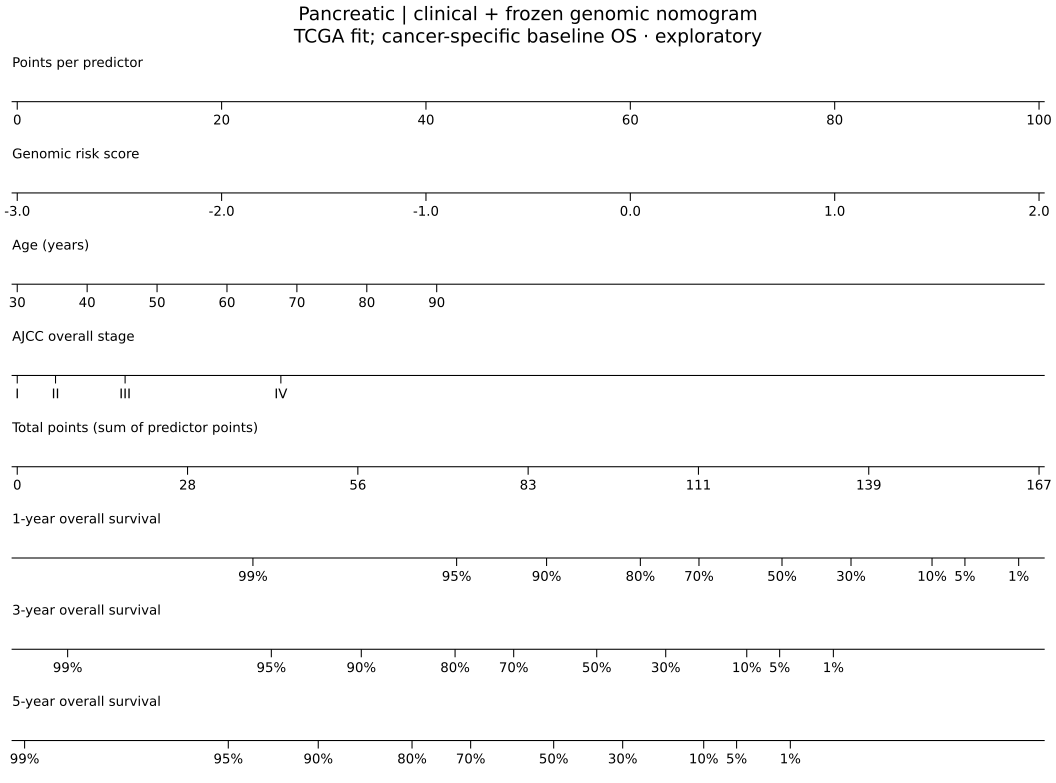
Select Include clinical nomogram in the predictor above. The frozen TCGA complete-case model (1,149 patients) combines score, age and AJCC stage, with shared coefficients and cancer-specific baseline hazards. It returns 1-, 3- and 5-year overall-survival estimates without refitting or recalibration.
Clinical model parameters · CRC nomogram · Gastric nomogram · Pancreatic nomogram
Selected expression files are read into this browser tab's memory. Predictions run in JavaScript without uploading the file to a prediction server. The app has no analytics, external scripts or persistent storage of your input. Hosting providers may retain ordinary page-access logs; that is separate from the expression data. Close or reload the tab to clear the loaded cohort.